Mục lục bài viết
Dạng Line graph trong IELTS Writing task 1
Line graph là dạng biểu đồ trong đó có chứa một hoặc một số đường, mỗi đường biểu diễn cho sự thay đổi của một yếu tố nào đó qua nhiều mốc trong một khoảng thời gian (có thể là tuần, tháng, năm, thập kỷ…). Nhiệm vụ của thí sinh là viết một đoạn văn ít nhất 150 từ để miêu tả thông tin hiển thị trong biểu đồ mà không nêu quan điểm của mình trong bài viết.
Dạng câu hỏi Line graphs là khá phổ biến trong IELTS Writing Task 1. Nó đòi hỏi chúng ta cần có một lượng kiến thức nhất định về từ vựng và chiến thuật làm bài để có thể đạt được điểm cao.
1. Line Graph là biểu đồ gì?
Line Graph, hay còn gọi là biểu đồ đường, là một loại biểu đồ sử dụng các điểm nối liền nhau bởi các đường thẳng để thể hiện sự thay đổi của dữ liệu theo thời gian hoặc một biến số khác.
Đặc điểm của Line Graph:
- Trục ngang: Thường thể hiện thời gian hoặc một biến số liên tục.
- Trục dọc: Thể hiện giá trị của dữ liệu.
- Điểm nối: Mỗi điểm trên đồ thị đại diện cho một giá trị dữ liệu tại một thời điểm hoặc giá trị của biến số.
- Đường thẳng: Nối các điểm lại với nhau, thể hiện xu hướng thay đổi của dữ liệu.
Line Graph được sử dụng trong nhiều lĩnh vực:
- Thống kê: Thể hiện sự thay đổi của dân số, GDP, lạm phát… theo thời gian.
- Kinh doanh: Thể hiện doanh thu, lợi nhuận, giá cổ phiếu… theo thời gian.
- Y tế: Thể hiện sự biến đổi của huyết áp, nhịp tim, cân nặng… theo thời gian.
- Khoa học: Thể hiện sự thay đổi của nhiệt độ, áp suất, độ cao… theo thời gian.
Ưu điểm của Line Graph:
- Thể hiện rõ ràng sự thay đổi của dữ liệu theo thời gian hoặc biến số.
- Dễ so sánh dữ liệu giữa các thời điểm hoặc giá trị của biến số.
- Có thể dễ dàng thêm vào các điểm dữ liệu mới.
- Dễ hiểu và dễ sử dụng.
Nhược điểm của Line Graph:
- Không thể thể hiện được nhiều biến số cùng lúc.
- Không phù hợp để thể hiện dữ liệu phân loại.
- Có thể bị ảnh hưởng bởi các sai số trong dữ liệu.
Tóm lại, Line Graph là một loại biểu đồ hiệu quả để thể hiện sự thay đổi của dữ liệu theo thời gian hoặc một biến số liên tục. Nó được sử dụng rộng rãi trong nhiều lĩnh vực khác nhau.
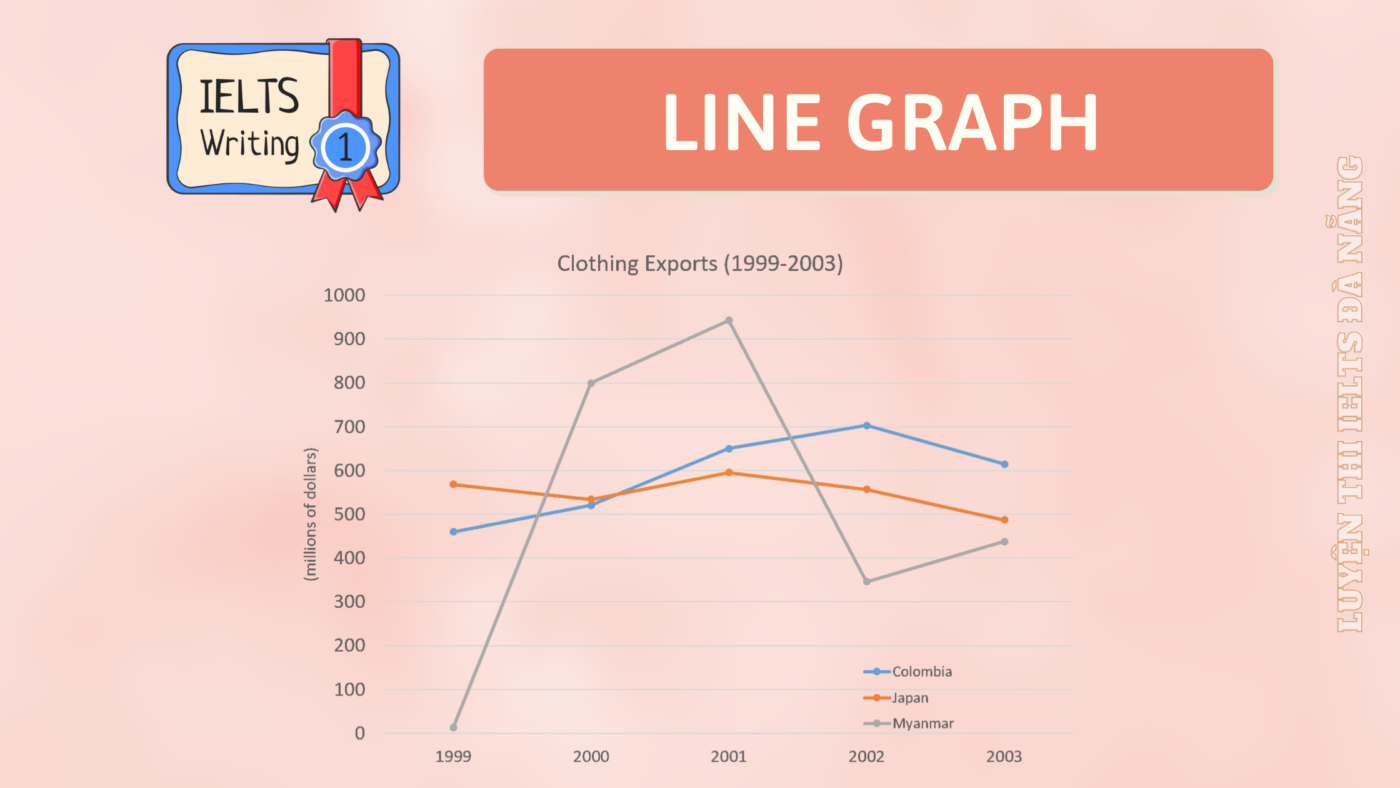
Ví dụ về biểu đồ Line Graph trong Writing IELTS Task 1 như sau:
2. Đặc điểm của dạng bài Line graph
Dạng Line Graphs có một số đặc điểm như sau:
– Là biểu đồ dễ để ĐỌC HIỂU nhất vì luôn có sự THAY ĐỔI THEO THỜI GIAN
Với các biểu đồ như Pie chart, Table hay Bar chart, đôi khi số liệu có thể có sự thay đổi theo thời gian, nhưng đôi khi số liệu lại không có sự thay đổi theo thời gian. Đôi khi người viết phải sử dụng cấu trúc so sánh, nhưng đôi khi lại chỉ tập trung vào cấu trúc mô tả xu hướng
Khác với những biểu đồ còn lại, Line graph luôn luôn là biểu đồ có sự thay đổi của thời gian (theo từng tháng, từng năm…) và mỗi một mốc thời gian sẽ có một dữ liệu cụ thể.
Nó có giúp chúng ta làm bài dễ dàng hơn không?
Có đấy các bạn nhé. Với sự góp mặt của yếu tố thời gian, người viết sẽ biết rằng:
- Nhiệm vụ chính khi mô tả Line Graph là làm rõ xu hướng thay đổi (tăng / giảm / giữ nguyên / dao động)
- Chỉ có 1 cách đọc biểu đồ duy nhất là theo thứ tự thời gian (đọc số liệu theo trục hoành – trục nằm ngang – theo thứ tự từ trái sang phải)
– Là biểu đồ DỄ VIẾT nhất vì không yêu cầu nhiều về từ vựng, ngữ pháp
Như mình vừa nhấn mạnh ở trên, Line Graph chỉ tập trung mô tả xu hướng của số liệu mà thôi, vậy nên để mô tả tốt về Line Graph, bạn chỉ cần chú ý 3 gạch đầu dòng như sau là có thể đảm bảo từ vựng tốt, ngữ pháp hay.
– Một cấu trúc bài viết Task 1 hoàn hảo sẽ phải đầy đủ 4 phần đó là:
- Introduction
- Overview
- Body 1
- Body 2
3. Các cấu trúc câu mô tả xu hướng trong bài Line graph
- Cấu trúc 1
| There + tobe + a/an + Adj + Noun + in S + Number + Time |
Ví dụ:
There was a significant increase in the number of people commuting by car from 1 to 5 million between 2000 and 2001
(Có một sự tăng lên đáng kể trong số lượng người đi lại bằng ô tô từ 1 lên 5 triệu giữa năm 2000 và 2001)
- Cấu trúc 2
| S + V (chỉ sự thay đổi) + Adv + Number + Time |
Ví dụ:
The number of people commuting by car increased significantly from 1 to 5 million between 2000 and 2001.
(Số lượng người đi lại bằng ô tô tăng lên đáng kể từ 1 lên 5 triệu giữa năm 2000 và 2001)
- Cấu trúc 3
| Time + witness/show/experience (chứng kiến, chỉ ra, trải qua) + a/an + Adj + Noun + in S + Number |
Ví dụ:
The period from 2000 to 2001 experienced a significant increase in the number of people commuting by car from 1 to 5 million.
(Trong giai đoạn từ năm 2000 đến năm 2001, số lượng người đi lại bằng ô tô đã tăng đáng kể từ 1 lên 5 triệu người.)
4. Các nhóm từ vựng mô tả xu hướng
Chúng ta chỉ có 4 xu hướng thay đổi chính trên Line Graph mà thôi: Tăng / Giảm / Giữ nguyên / Dao động
Để mô tả các xu hướng này đa dạng, không trùng lặp từ vựng thì bạn hãy nên sở hữu cho mình nhiều từ vựng hay và linh hoạt để mô tả. Tuy nhiên thay vì phải tự mình sưu tầm, các bạn chỉ cần download ở link bên dưới, mình đã tổng hợp giúp bạn rồi.
– 3 nhóm thì phổ biến để chia động từ
- Nếu thời gian biểu thị trong quá khứ, bạn bắt buộc phải dùng thì quá khứ trong bài viết
- Nếu thời gian kéo dài từ quá khứ (1990) đến tương lai (2040) thì có thể sử dụng cả thì hiện tại đơn hiện tại hoàn thành nhé
- Nếu thời gian biểu thị trong tương lai thì bạn cần ứng dụng cấu trúc câu dự đoán nhé
Xem thêm: Cách viết bài IELTS Writing task 1 dạng bài Line graph
IELTS Writing Task 1 dạng Line Graph – Sample
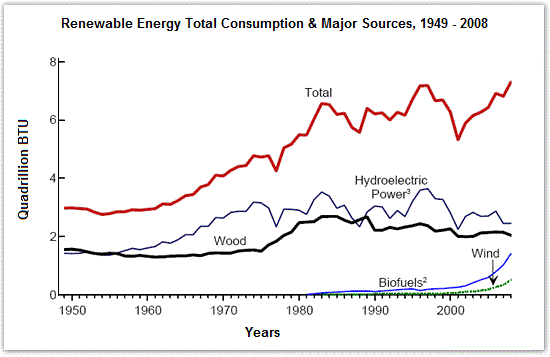
Đề 1: The diagram shows the consumption of renewable energy in the USA from 1949-2008. Write a 150-word report for a university lecturer identifying the main trends and making comparisons where relevant.
Sample answer
The line graph shows growth in the consumption of renewable energy during the period 1949-2008 in the USA. The results are also broken down by source.
The first thing to note is that renewable energy use more than doubled over the period, with particularly strong growth in biofuels. This sector did not exist in 1980 but experienced a steep rise during the 2000s to over one quadrillion BTU per year. This made biofuels a serious challenger to both wood and hydroelectric power, which both saw only limited growth overall. The former grew steadily between 1975 and 1985, but then slipped back to around its original level of 1.8 quadrillion BTU. The latter began the period at the same level as wood but experienced more substantial growth.
However, it also fell back to around 2 quadrillion BTU, with a particularly sharp drop in the late 1990s.
Finally, wind power emerged late in the period but showed a gradual rise to around 0.5 quadrillion BTU, suggesting that it, along with biofuels, will replace wood and hydroelectricity as the main sources of renewable every in the future.
By ZIM
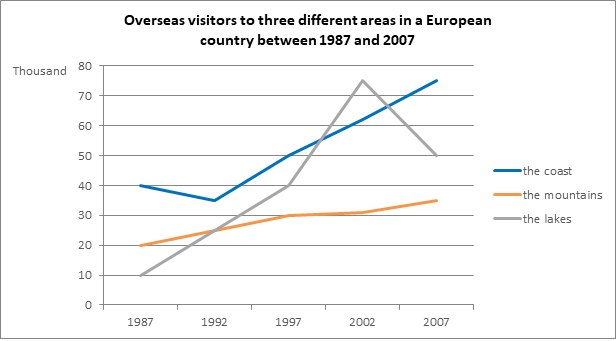
Đề 2: The graph below shows the number of overseas visitors to three different areas in a European country between 1987 and 2007.
Sample answer
The given line graph depicts information about how many foreigners visited three separate regions in a European nation, during the span of a 20-year period from 1987 to 2007.
Overall, the most notable detail is that those three regions all attracted an increasing number of foreigners. In addition, the lakes’ tourist figures witnessed the most dramatic change among those given.
In more detail, at approximately 10,000 visitors in 1987, the quantity of foreign travelers who were attracted to the lakes gradually rose to around 50,000 in 2000, before peaking at approximately 75,000 tourists in 2002, This figure then dropped back down to approximately 50,000 people in 2007.
With regards to tourist numbers in coastal and mountainous areas, the overall figures increased, however mountainous areas remained the least attractive travel option out of the three. In 1987, the number of those who chose the coast as a travel destination stood at 40,000, compared to only 20,000 travelers who went to the mountains. In the next 14 years, the coast witnessed a slight decrease in the quantity of visitors by a few thousand, which was followed by a significant climb to around 60,000 people, whereas the number of those visiting mountainous areas went up remarkably to 30,000 in 2001.
In the final 6 years, while the quantity of overseas tourists going to the coast rose moderately to above 70,000, there was a slight climb in those who paid a visit to the mountains to about 35,000.
By ZIM
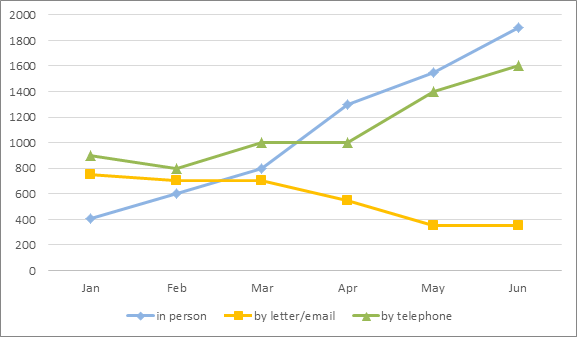
Đề 3: The graph below shows the number of enquiries received by the Tourist Information Office in one city over a six-month period in 2011.
Sample answer
The line chart illustrates the number of inquiries sent to the Tourist Information Office in a particular city via three means of communication, between January and June in 2011.
It is clear that visitors to the city made more inquires in person and via telephone, while written letters and emails became the least common choices. Additionally, the number of enquiries in person experienced the most dramatic change among the different options.
In January, the Tourist Information Office received 900 telephone enquiries, while just under 800 letters and emails were received. Not many tourists chose to ask for information in person, with just over 400 queries. Over the next three months, the telephone still remained the most popular method of enquiry, at approximately 1000 queries.
Meanwhile, the number of enquires made in person saw considerable growth to 800, surpassing the figures for emails and postal enquires. From March to June, enquires in person were the most common method of inquiry. By June, the number of in person enquires soared by more than 1,000 to peak at 1,900. During this period, there was also a significant rise in the figure for telephone enquiries, from 1000 to 1600. By contrast, fewer people sent emails or letters to make enquires, with slightly less than 400 enquires in May and June.
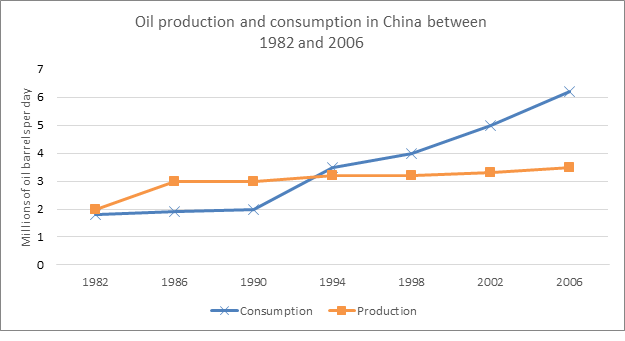
Đề 4: The line graph below shows the oil production and consumption in China between 1982 and 2006.
Trên đây là một số bài mẫu trong IELTS Writing Task 1 dạng Line Graph. Bạn có thể Tải trọn bộ 15 bài mẫu miễn phí TẠI ĐÂY. Chúc các bạn luyện thi IETLS hiệu quả.
Xem thêm: Tổng hợp đề thi IELTS Writing 2021 (kèm bài mẫu) | Cập nhật liên tục

